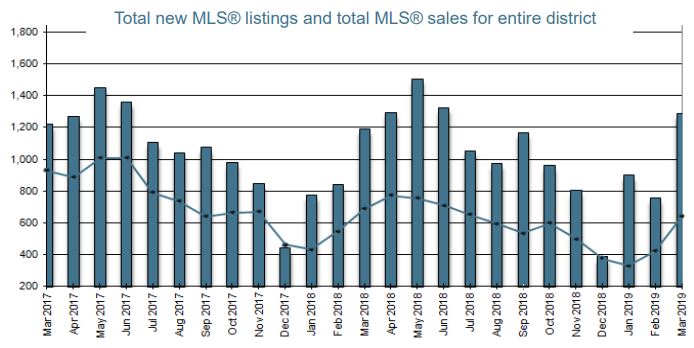
With the arrival of our welcome warm spring weather, the market has heated up and real estate signs are popping up along with the spring flowers.
Sales increased 52% in March to 640 sales from just 421 sales in our cold and snowy February, but still down 7% from 688 sales in March of 2018.
The number of listings actively available for sale rose another 14% from 2,131 at the end of February to 2,435 at the end of March and up 38% from the 1,766 available at the end of March 2018. While the supply has increased substantially, it still lags below the 10 year average of 3,403.
Overall with a ratio of 1 sale to 4 listings in March, a 4 month supply, we are experiencing a balanced market. As is normally the case, there are different…
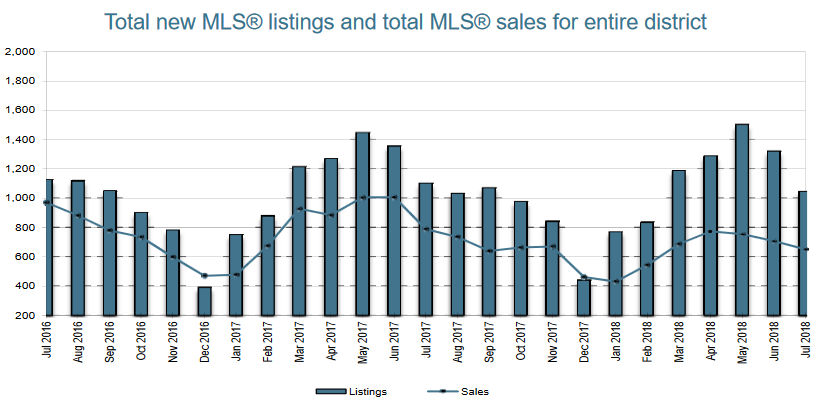
This is getting repetitive, but again sales are down and listings are up. That's more than 12 consecutive months now of fewer sales and more listings than the previous year.
In February there were a total of 421 properties sold in the Victoria Real Estate Board (Sidney to Sooke to Oak bay to South of Duncan AND the Gulf Islands), that's 23% fewer than the 545 sold in February 2018 but an encouraging and seasonal increase of 28% more than in the month before, January 2019. Condo sales were down 26% from the previous year with 129 sold, also up 16% from the previous month. Single family home sales were down 16% from the previous year with 219 sold.
The supply of active listings available for sale remains historically low but has been…
Target foreign and domestic speculators who own residences in B.C. but don’t pay taxes here
Turn empty homes into good housing for people
Raise revenue that will directly support affordable housing
All owners of residential property in the designated taxable regions of B.C. must complete an annual declaration. Over 99% of British Columbians are estimated to be exempt from the tax.
How to Exempt Yourself
To claim your exemption, you must register your property by March 31, 2019 – and it’s easy to do, either by phone or online. The information you’ll need to register your property declaration will be mailed by mid-February to all owners of residential property within the taxable
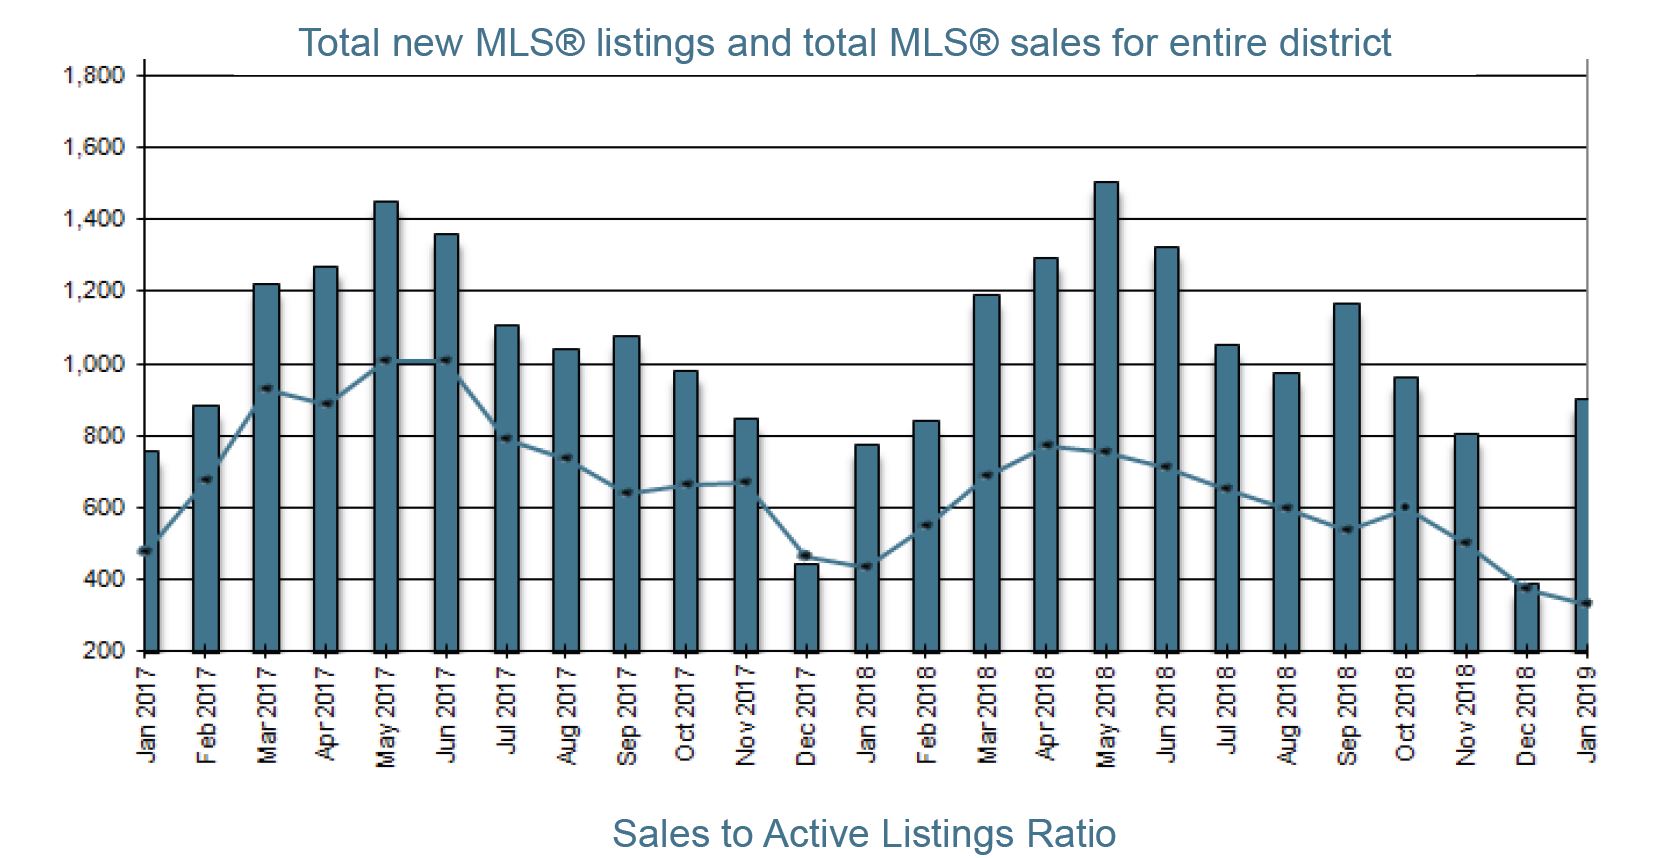
Our report has been somewhat repetitive over the past few months with the continuing trend of fewer sales and more listings for sale. We are starting to see price declines across most property types, areas and price ranges.
Last month there were 329 properties sold in Greater Victoria, 24% fewer than the 431 sold in January of 2018 and also 12% fewer than December. Condo sales were down only 6% while single family sales were down 29% from the previous year. Last year in January the numbers were already down significantly from the prior year due to the introduction of the new mortgage stress test. Sales levels are now significantly below the 10 year average.
The supply of active listings available for sale in the VREB at the end of January 2019…
The trend of fewer sales and more listings available for sale continued through the end of the year with just 375 properties sold in the Victoria Real Estate Board in December 2018, 19% fewer than the 462 sold in December 2017 and 25% less than sold in November.
In 2018 in total 7,150 properties were sold , 20% fewer than the 8,994 sold in 2017. That's also 33% less than the record 10,622 the previous year and now below the 7,351 10 year average. The number of Single Family Homes sold in 2018 was down 22% in 2018 to 3,187 from 4,069 in 2017. Condo sales also declined 23% to 2,150 in 2018 from 2,773 in 2017.
There were 1,998 active listings available for sale on the VREB MLS at the end of December 2018, up 44% from the end of December a
The trend of decreasing sales volume continued in November with a total of 498 properties sold, 17% fewer sales than in October and 26% fewer than the 671 sold in November of last year. Condo sales were down 31% and single family sales were down 21%. In the fall of 2017 the federal government announced the changes to mortgage lending rules which came into effect January 1, 2018 and led to a frenzy of activity in November and December 2017. Last months sales volume was just 3% lower than our 10 year average sales volume of 515 in November.
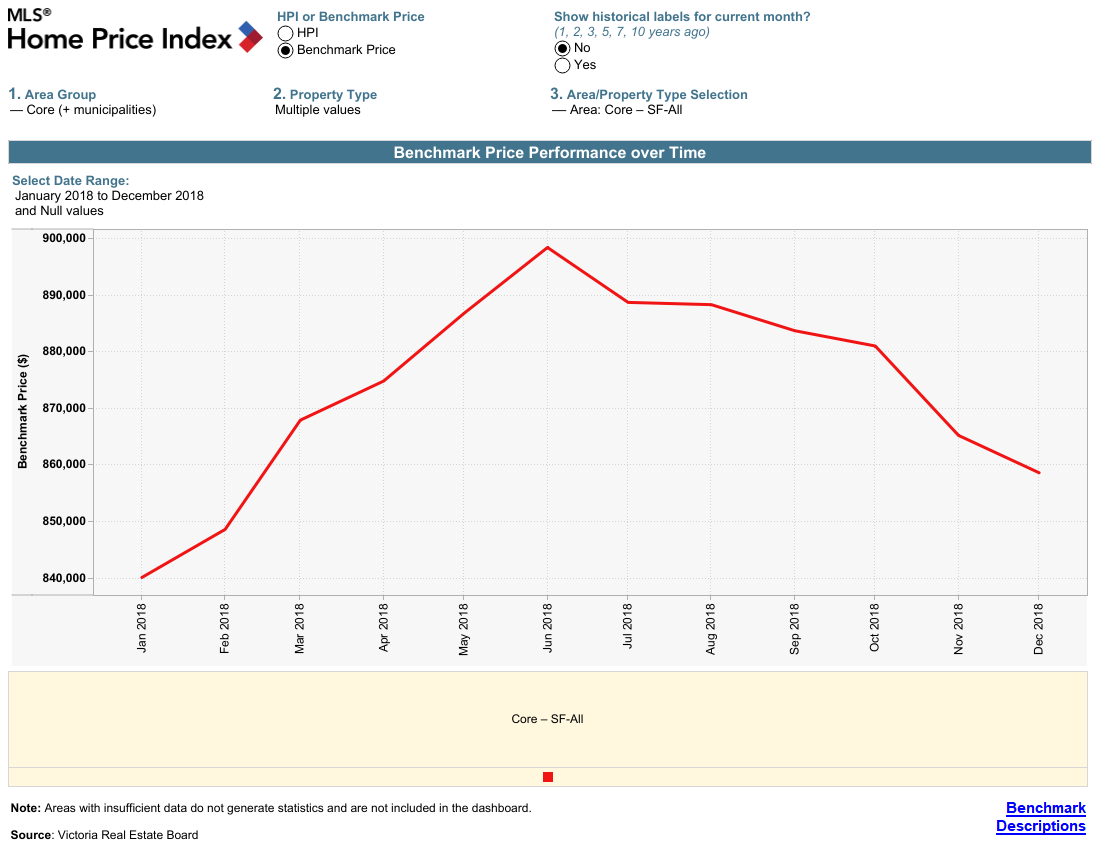
The MLS (Multiple Listing Service) HPI (Home Price Index) benchmark value for a single family home in the Victoria Core (Victoria, Vic West, Esquimalt, Oak Bay, Saanich and View Royal) was up 4% to $865,200 from…
>Last month we saw a small normal seasonal increase in sales over to 598 sold over the 533 sold in September, but down 10% from the 664 sold in October last year. There were 15% fewer condos and single family homes sold in October compared to October of the previous year.
The supply of homes available for sale was up to 2,510 actively for sale at the end of October, that's 32% higher than at the end of October last year.
The simple overall math is that we now have a 4 month supply which suggests a "balanced market". A closer look shows significant differences in this "balance" in different areas, property types and price ranges. Some continue to be relatively under supplied with competing bids while others are seeing almost no activity and
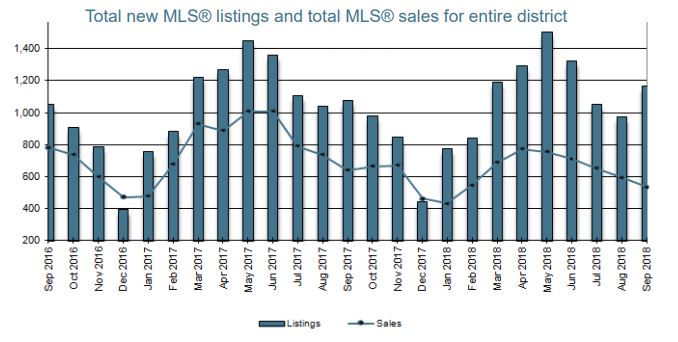
The downward trend for real estate sales in Greater Victoria continued with a total of just 533 sold in September 2018, 16% fewer than the 640 sold last September 2017 and 10% fewer sales than last month, August 2018. This is contrary to the typical seasonal increase in sales after summer.
At the same time the upward trend with our supply of listings available for sale continued with 2,646 for sale at the end of September 2018, 5% than the month before and 34% more than the 1,976 available at the end of September 2017.
This apparent balanced level of supply and demand means we now have a 5 month overall supply of listings available for sale. Of course as reported in previous…
The trend to a balanced market continued through August with a further decline in sales to just 594 properties sold in the Victoria Real Estate Board in August, a decrease of 8.8% from the 651 sold in July and 19.3% fewer than the 736 sold in August of 2017.
The overall supply of active listings increased to 2,519 at the end of August, 31.4% higher than the 1,917 available at the same time last year.
There are significant differences among various price ranges, property types and neighbourhoods with continued limited selection below $750,000, 30% fewer available than this time last year and increasing availability above $1,500,000 where selection has more than doubled.
The VREB Home Price Index indicates that benchmark values of
While the summer weather has heated up the real estate market is generally cooling off. In July the trend of increasing listings available for sale and fewer sales continued with just 651 properties sold a decline of 17.6% from the 790 sold in July 2017. The number of listings available for sale was up to 2,607 at the end of July from 1,921 at the end of July last year.
Overall the proportion of listings available for sale relative to the number selling represents a balanced market with four month supply. Looking a little closer at specific property types, neighbourhoods and price ranges quickly reveals that there are significant differences in various parts of the market. For example under $750,000 in Victoria's core there are currently only 347
 With the arrival of our welcome warm spring weather, the market has heated up and real estate signs are popping up along with the spring flowers.
Sales increased 52% in March to 640 sales from just 421 sales in our cold and snowy February, but still down 7% from 688 sales in March of 2018.
The number of listings actively available for sale rose another 14% from 2,131 at the end of February to 2,435 at the end of March and up 38% from the 1,766 available at the end of March 2018. While the supply has increased substantially, it still lags below the 10 year average of 3,403.
Overall with a ratio of 1 sale to 4 listings in March, a 4 month supply, we are experiencing a balanced market. As is normally the case, there are different…
With the arrival of our welcome warm spring weather, the market has heated up and real estate signs are popping up along with the spring flowers.
Sales increased 52% in March to 640 sales from just 421 sales in our cold and snowy February, but still down 7% from 688 sales in March of 2018.
The number of listings actively available for sale rose another 14% from 2,131 at the end of February to 2,435 at the end of March and up 38% from the 1,766 available at the end of March 2018. While the supply has increased substantially, it still lags below the 10 year average of 3,403.
Overall with a ratio of 1 sale to 4 listings in March, a 4 month supply, we are experiencing a balanced market. As is normally the case, there are different… 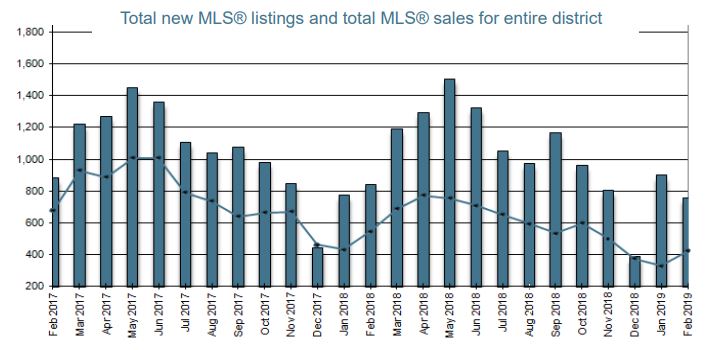

 Our report has been somewhat repetitive over the past few months with the continuing trend of fewer sales and more listings for sale. We are starting to see price declines across most property types, areas and price ranges.
Last month there were 329 properties sold in Greater Victoria, 24% fewer than the 431 sold in January of 2018 and also 12% fewer than December. Condo sales were down only 6% while single family sales were down 29% from the previous year. Last year in January the numbers were already down significantly from the prior year due to the introduction of the new mortgage stress test. Sales levels are now significantly below the 10 year average.
Our report has been somewhat repetitive over the past few months with the continuing trend of fewer sales and more listings for sale. We are starting to see price declines across most property types, areas and price ranges.
Last month there were 329 properties sold in Greater Victoria, 24% fewer than the 431 sold in January of 2018 and also 12% fewer than December. Condo sales were down only 6% while single family sales were down 29% from the previous year. Last year in January the numbers were already down significantly from the prior year due to the introduction of the new mortgage stress test. Sales levels are now significantly below the 10 year average.
 The trend of fewer sales and more listings available for sale continued through the end of the year with just 375 properties sold in the Victoria Real Estate Board in December 2018, 19% fewer than the 462 sold in December 2017 and 25% less than sold in November.
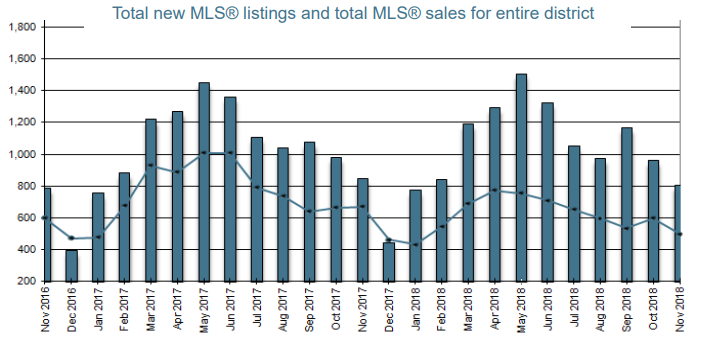 The trend of decreasing sales volume continued in November with a total of 498 properties sold, 17% fewer sales than in October and 26% fewer than the 671 sold in November of last year. Condo sales were down 31% and single family sales were down 21%. In the fall of 2017 the federal government announced the changes to mortgage lending rules which came into effect January 1, 2018 and led to a frenzy of activity in November and December 2017. Last months sales volume was just 3% lower than our 10 year average sales volume of 515 in November.
The MLS (Multiple Listing Service) HPI (Home Price Index) benchmark value for a single family home in the Victoria Core (Victoria, Vic West, Esquimalt, Oak Bay, Saanich and View Royal) was up 4% to $865,200 from…
The trend of decreasing sales volume continued in November with a total of 498 properties sold, 17% fewer sales than in October and 26% fewer than the 671 sold in November of last year. Condo sales were down 31% and single family sales were down 21%. In the fall of 2017 the federal government announced the changes to mortgage lending rules which came into effect January 1, 2018 and led to a frenzy of activity in November and December 2017. Last months sales volume was just 3% lower than our 10 year average sales volume of 515 in November.
The MLS (Multiple Listing Service) HPI (Home Price Index) benchmark value for a single family home in the Victoria Core (Victoria, Vic West, Esquimalt, Oak Bay, Saanich and View Royal) was up 4% to $865,200 from… 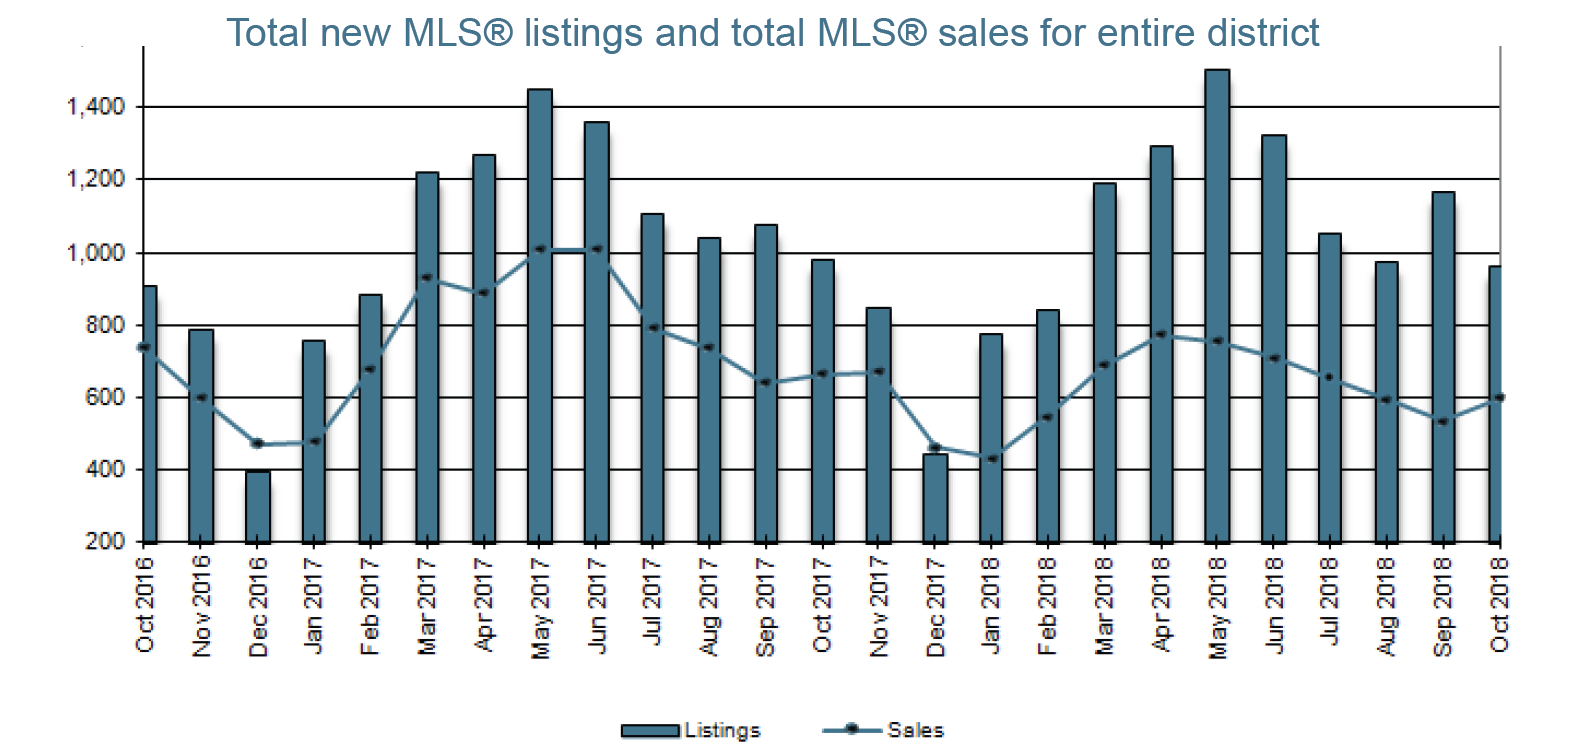 Last month we saw a small normal seasonal increase in sales over to 598 sold over the 533 sold in September, but down 10% from the 664 sold in October last year. There were 15% fewer condos and single family homes sold in October compared to October of the previous year.
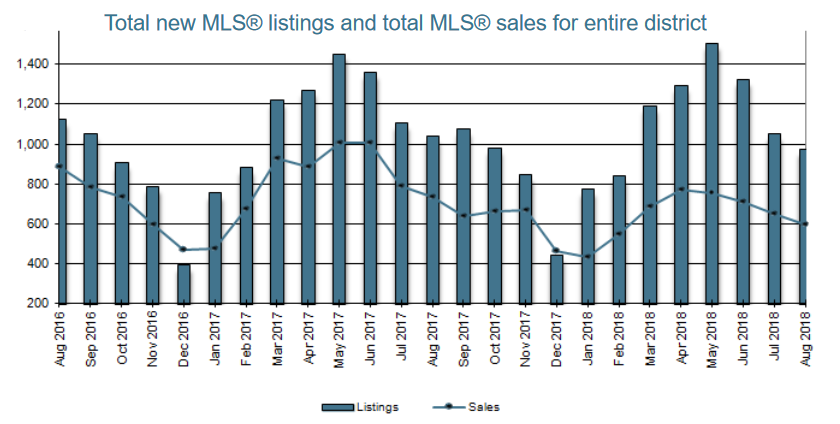 The trend to a balanced market continued through August with a further decline in sales to just 594 properties sold in the Victoria Real Estate Board in August, a decrease of 8.8% from the 651 sold in July and 19.3% fewer than the 736 sold in August of 2017.
 While the summer weather has heated up the real estate market is generally cooling off. In July the trend of increasing listings available for sale and fewer sales continued with just 651 properties sold a decline of 17.6% from the 790 sold in July 2017. The number of listings available for sale was up to 2,607 at the end of July from 1,921 at the end of July last year.