Victoria & Vancouver Island Real Estate Blog
B.C. First-Time New Home Buyers' $10,000 Bonus
Qualifications
You may qualify for the bonus if you meet all of the following criteria:- You purchase or build an eligible new
RBC ECONOMICS RESEARCH - ECONOMIC UPDATE
- Existing home sales in the US unexpectedly slipped by 1.0% to 4.94 million annualized units in December 2012 from a revised 4.99 million (previously reported as 5.04 million) in November. Market expectations had been for sales to rise to 5.10 million in December.
- The drop in sales was outpaced by an 8.5% decline in the number of homes available for sale in December. With inventories falling faster than sales, the months’ supply of unsold homes declined to 4.4 from 4.8 in November. This marked the lowest months’ supply since May 2005.
- Consistent with tightening inventories as well as a declining share of distressed property sales, the median price of existing homes jumped by 11.5% on a
Some NEED to knows regarding US Real Estate
A few things you need to know when Buying or Selling US Real Estate
FIRPTA FOR SELLERS: As a Canadian selling your home, the US Government takes 10% withholding tax on any home/condo that a foreigner sells... How do I prevent 10% withholding tax?
- File a 8288 form found at irs.gov
- Ask yourself these 3 questions: If yes to all 3 questions -- the Canadian seller MAY be exempt from paying the US Government 10% withholding tax
- Is the condo/home I am selling under $300,000 US?
- Is my condo/home a residential property?
- Is the buyer of my condo/home going to occupy as a primary/secondary owner? (so, if the buyer is going to turn the home/condo into a rental -- you now just lost your exemption)
FIRPTA AS A BUYER: If you are a
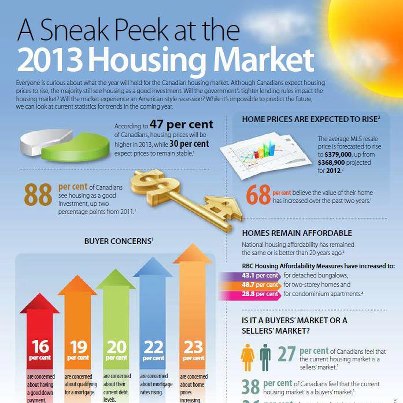
…Home Prices Could Jump 9.7% in 2013, J.P. Morgan Says
Ron’s January 2013 Market Update and Victoria Real Estate Board Report

Ron's candid thoughts:
While statistics indicate relative price stability, our experience continues to confirm that sellers in distress are competing for the relatively scarce ready, willing and able buyers. Increasingly while the average sale price shows only a few percentage points decline, what Buyers are actually getting for their money has changed significantly, particularly over the last six months since the mortgage rule changes. Having said that, I’m seeing an increasing sentiment of it being a good time to buy and on our team we experienced a flurry of activity finishing the year with a busy December even getting an offer together on Christmas Eve. Nationwide consumer sentiment seems to be generally optimistic according to reports from
…Dear first-time homebuyer: Ottawa wants you to tread carefully.....
Your government is increasingly worried about you getting into the housing market, if you haven’t figured it out by now. Ottawa has made it harder for you to get credit and is trying to limit how much debt you can take on. Has the message sunk in yet? The real estate industry says yes, and points to a dramatic drop in sales over the past few months as proof new mortgage regulations have stifled the market. The lesson for consumers is to tread slowly.
It’s a reality check for a lot of buyers in the market for what they could realistically afford
Gregory Klump, chief economist at the Canadian Real Estate Association, agrees there is little doubt the government has cast its eye at the first-time buyer. “They are the ones that generally take out
…Realtors Blame Flaherty as Slump Deepens
Greater Victoria Real Estate Sales Slow but Steady in Buyers' Market
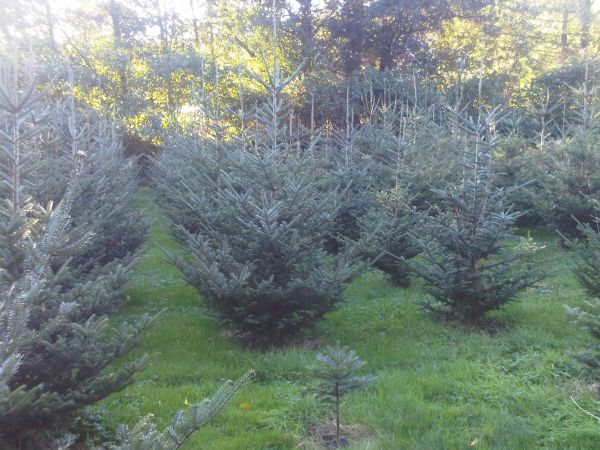
Local Live or u-cut Christmas Trees - Courtesy of Sparton Acres Farm, Ron Neal’s home
100% organic and pesticide free local Christmas trees - Courtesy of Sparton Acres Farm, Ron Neal's home

Apartment to hotel lobby sizes, many varieties, U-cut, we-cut or live Pick any tree for minimum only $40 minimum donation, 100% proceeds to BC Children's Hospital Foundation or charity of your choice Lots of flexibility for timing, please contact us before coming to avoid dissappointment, email or call 250.213.8788 for appointment DELIVERY AVAILABLE IN GREATER VICTORIA
